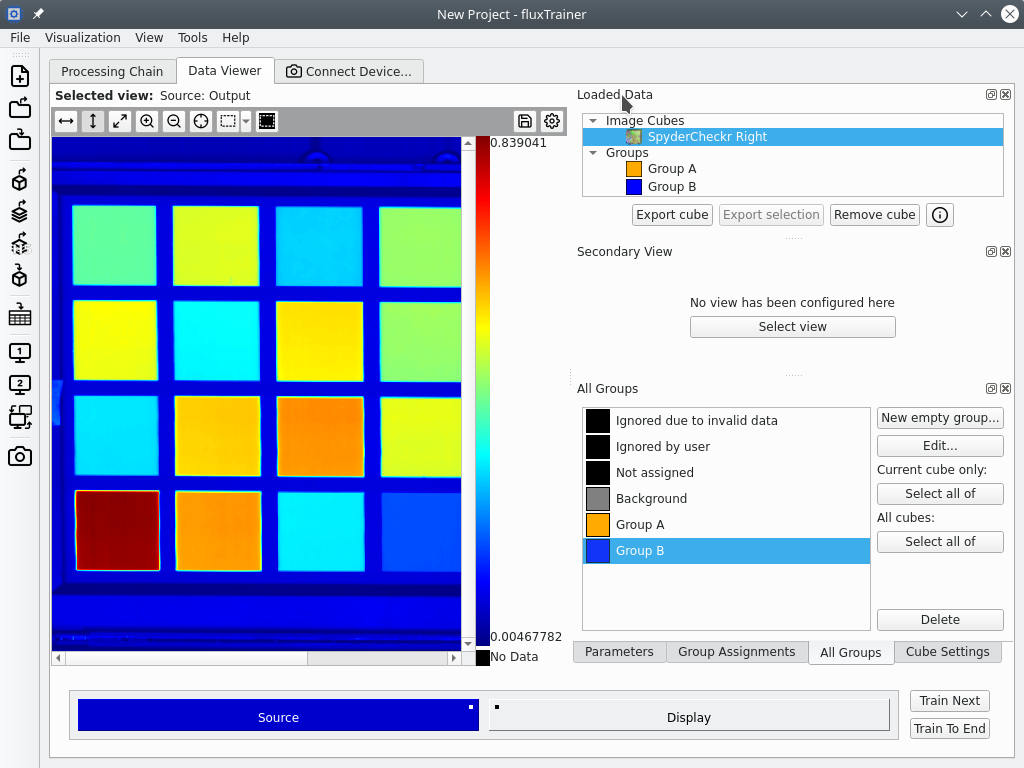
Data Viewer
The Data Viewer tab is used to analyze data with the model created in the Processing Chain tab, as well as train any machine learning filters.
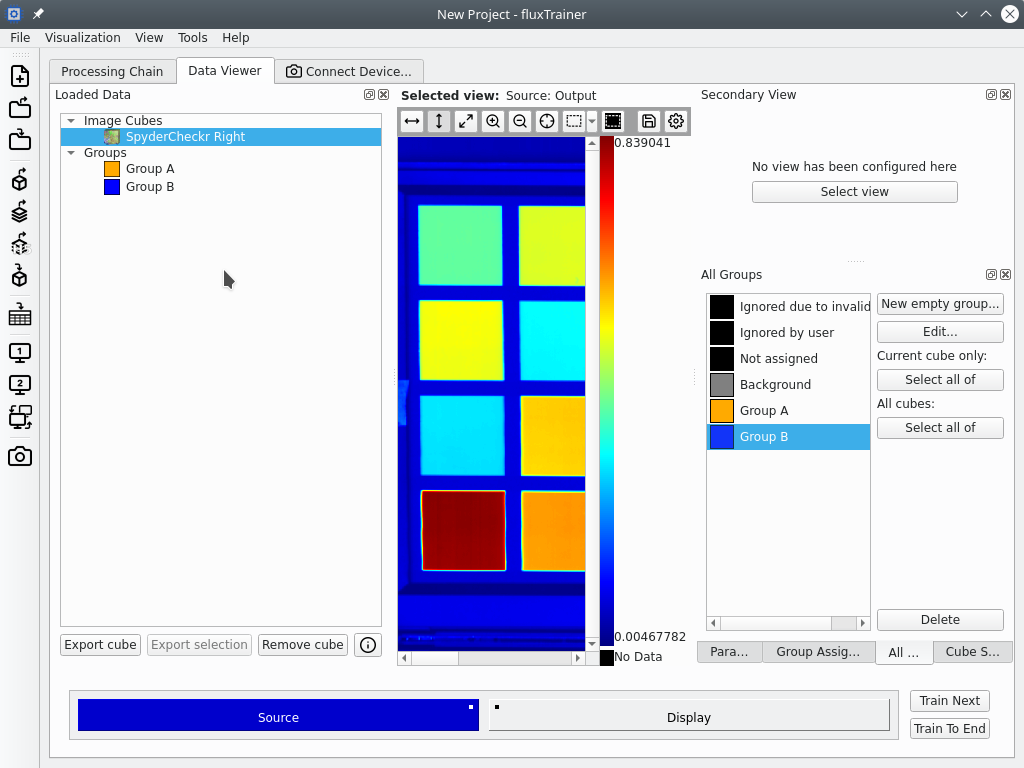
It is divided into four main regions:
The main view area
The right dock area (containing all 6 dock widgets)
The left dock area (empty by default)
The training progress area (bottom)
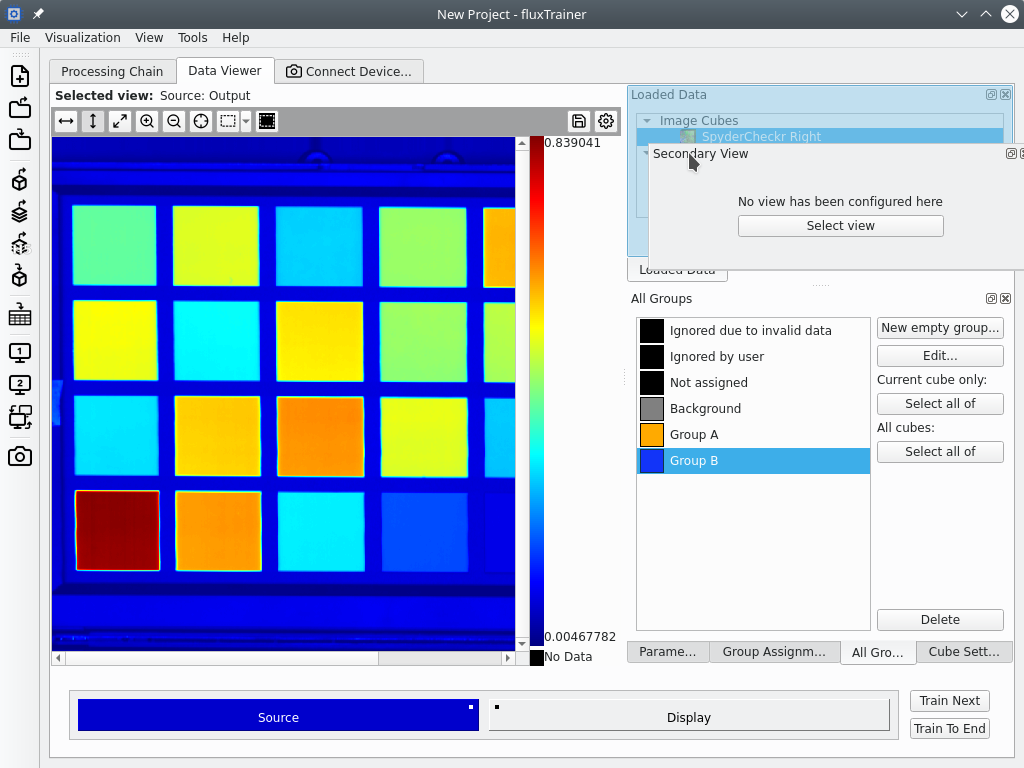
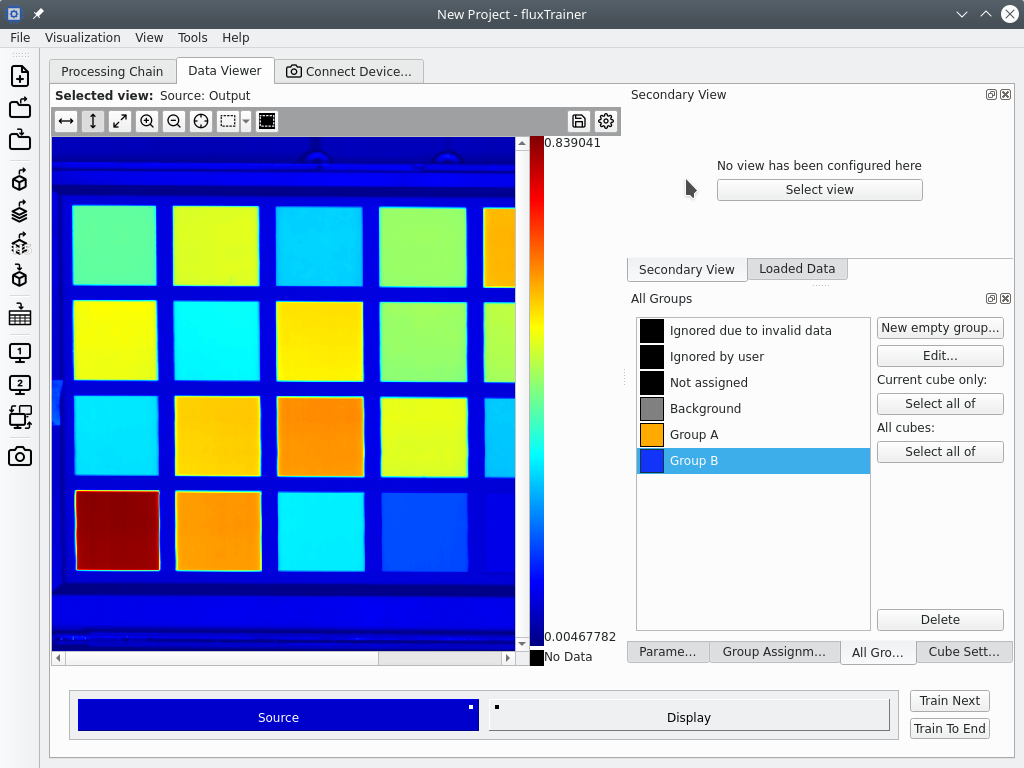
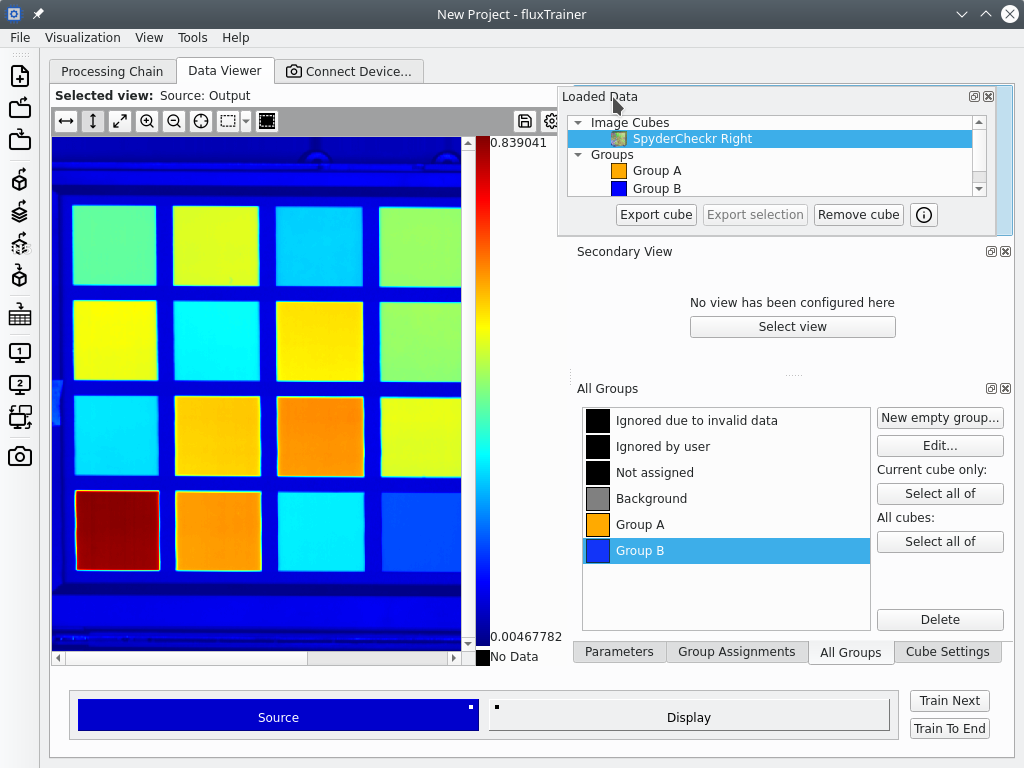
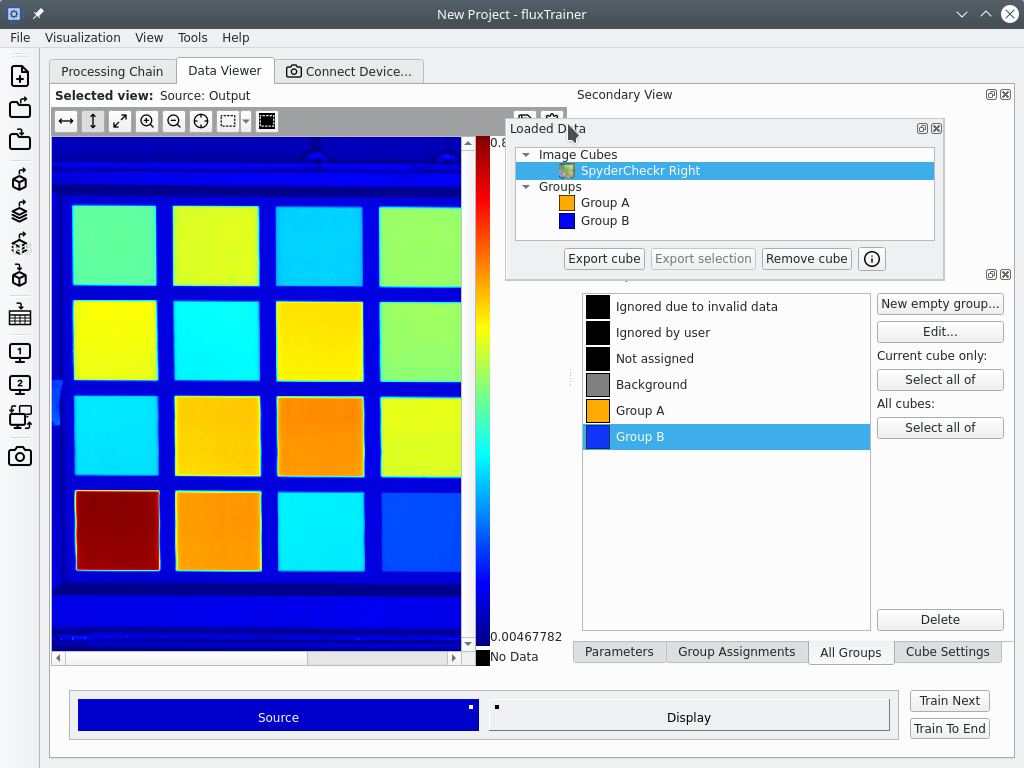
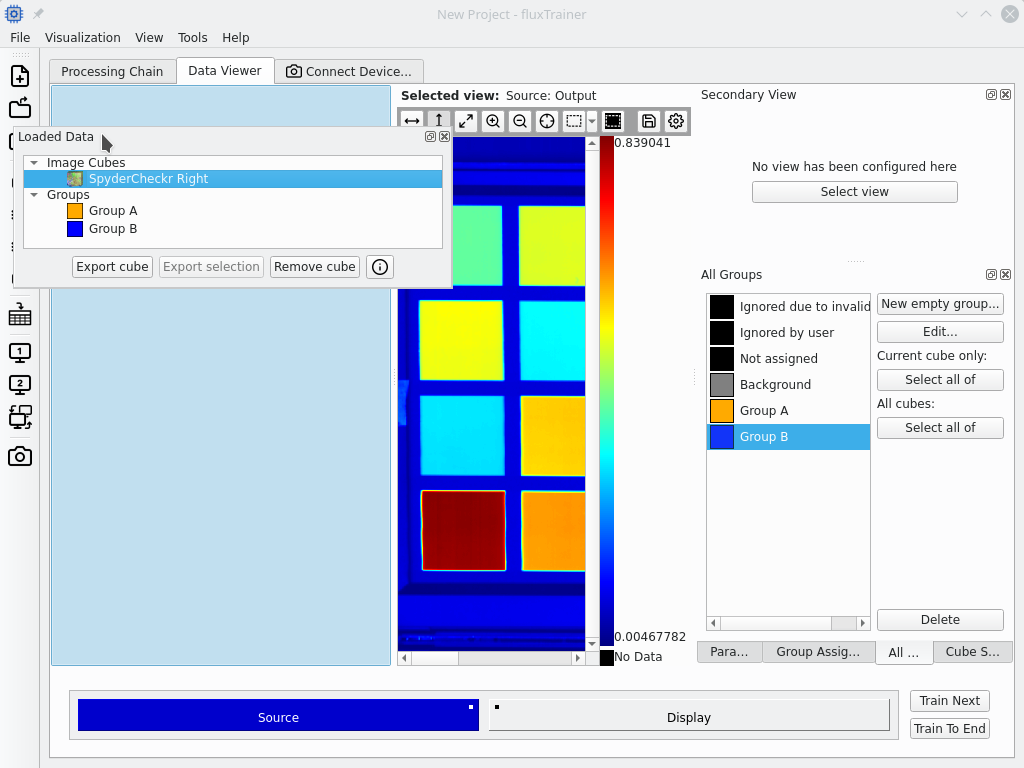
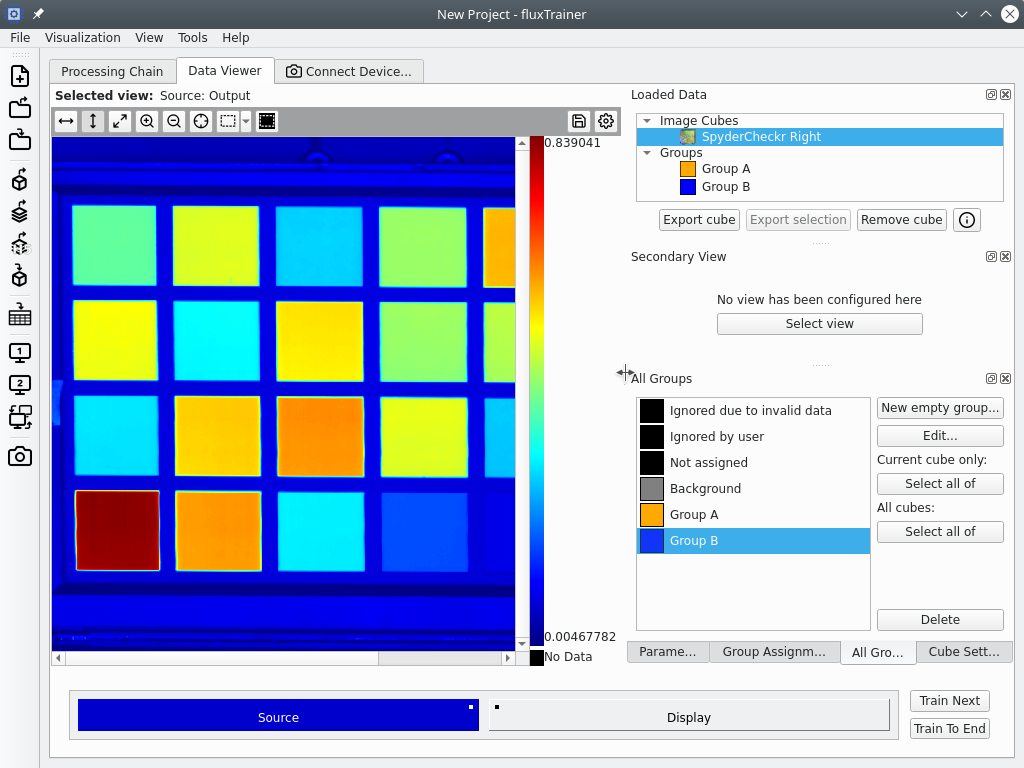
The data viewer can be customized by moving around the individual dock widgets. For example, to move the Loaded Data dock widget to the left dock area, press down the left mouse button on the title of the dock widget, and drag it to the left area:
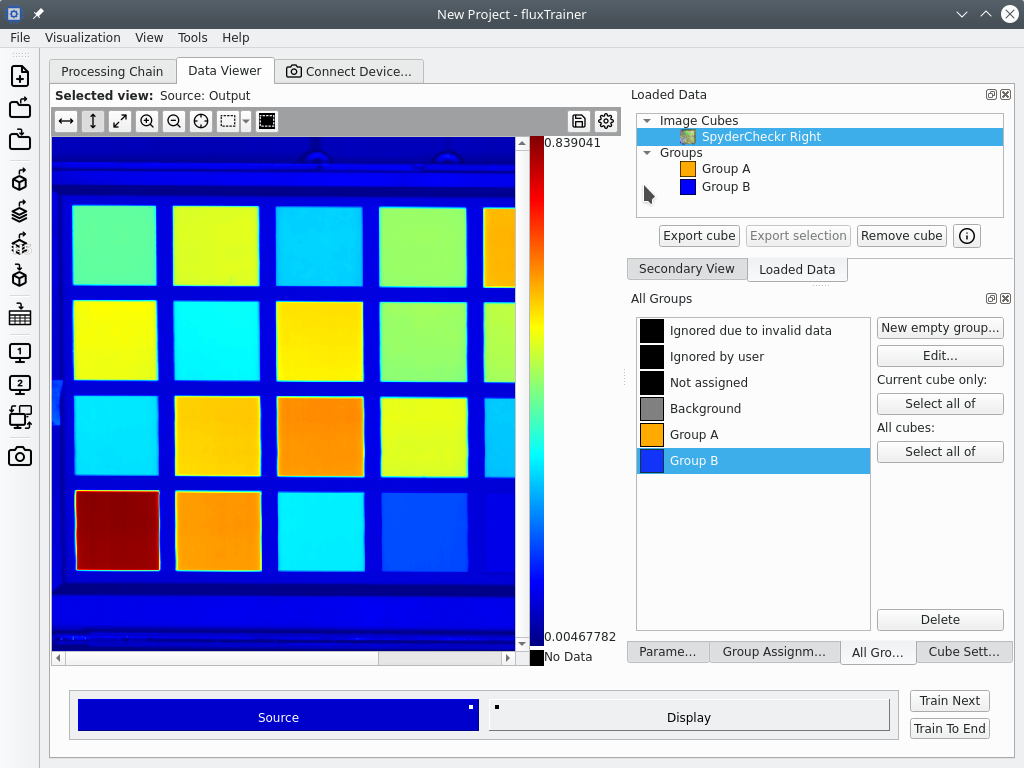
It is also possible to resize how big the dock areas are in relation to the main image view:
Resizing the dock widgets within a dock are is also possible:

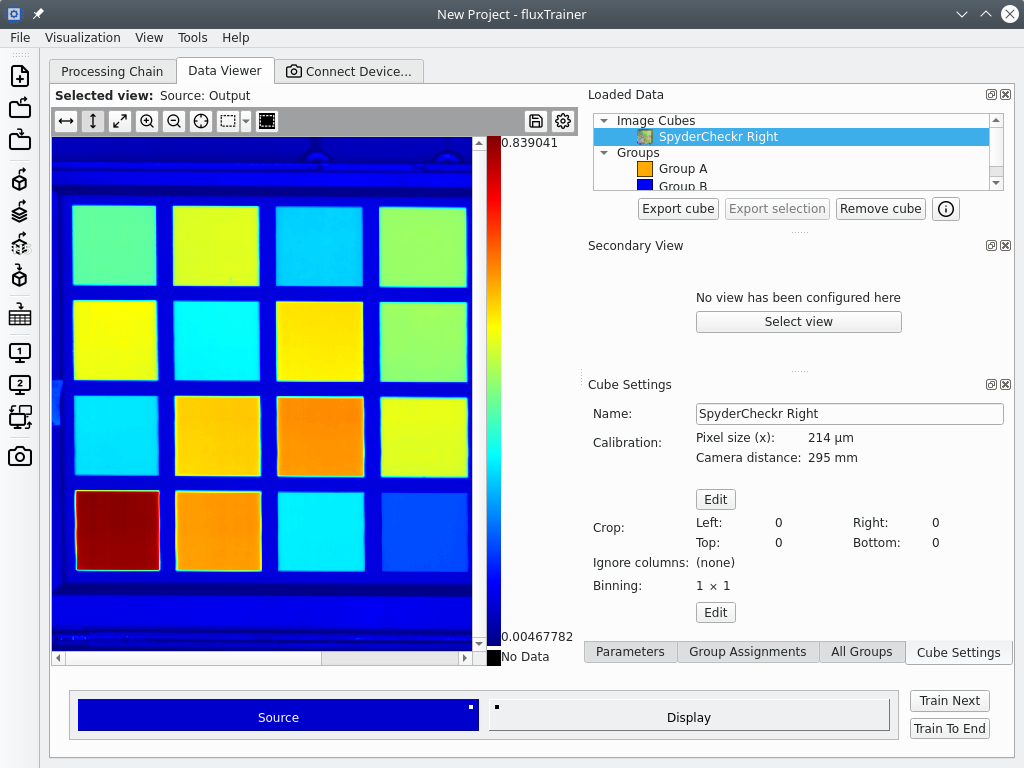
Finally, by dragging a dock widget on top of another dock widget, it is possible to combine both dock widgets into one, so that only one is visible at the same time, but tabs can be used to switch between them: