Player
The Player allows the user to apply models created in fluxTrainer to camera data live.
Note
The player is not available if the user has connected an XY table.
Player Settings
Once a camera has been connected in fluxTrainer, an additional box is added to the settings list named Player Settings:
This allows the user to load a model and configure the player views.
Choosing Model
There are three possible sources for the model that the player uses:
The current model created in fluxTrainer. For this to work the model has to be trained to the end in the Data Viewer tab.
An outdated version of the current model created in fluxTrainer. This cannot be selected explicitly, but if the user makes changes to the model after having chosen to use the current model in the Player, the Player will still use the old model, and mark the model that is being used as Current model (outdated) to indicate that it does not correspond to the actual current model anymore.
A
.fluxmdlfluxEngine model that was previously exported to a file.
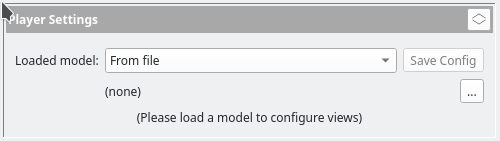
A dropdown in the player settings allows the user to select whether to use a file or the current model. It is not possible to switch the dropdown to Current model if the current model in fluxTrainer has an error.
If From file is selected the name of the file is displayed below the dropdown. Next to it is a … button that allows the user to select a file on disk.
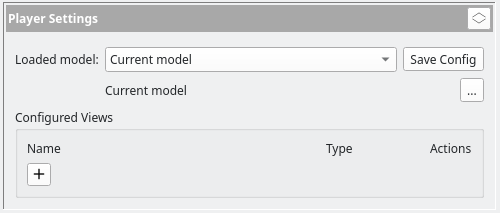
After either loading a file from disk or successfully selecting the current model, which views will be used can be configured below:
Configure Views
In order to configure views for the Player, the user must have added Display Sinks to the model. For each display sink the user can add one or more views to the Player.
Click the ![]() Add View button in the
Player Settings to add a new view. This will open a new window where
the corresponding view can be configured:
Add View button in the
Player Settings to add a new view. This will open a new window where
the corresponding view can be configured:
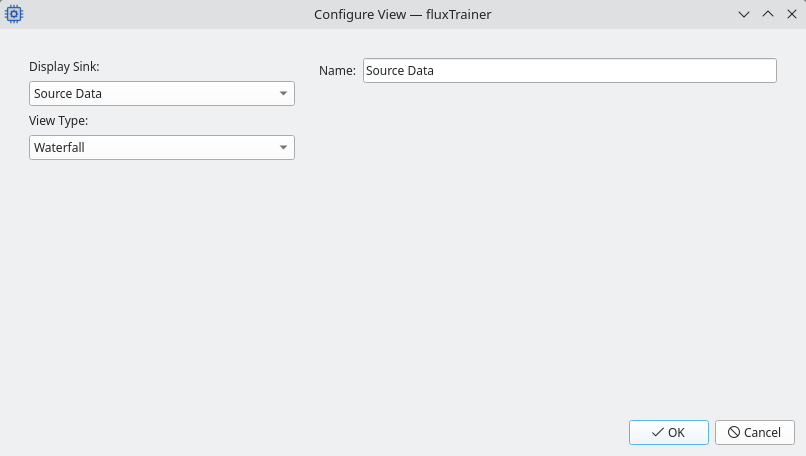
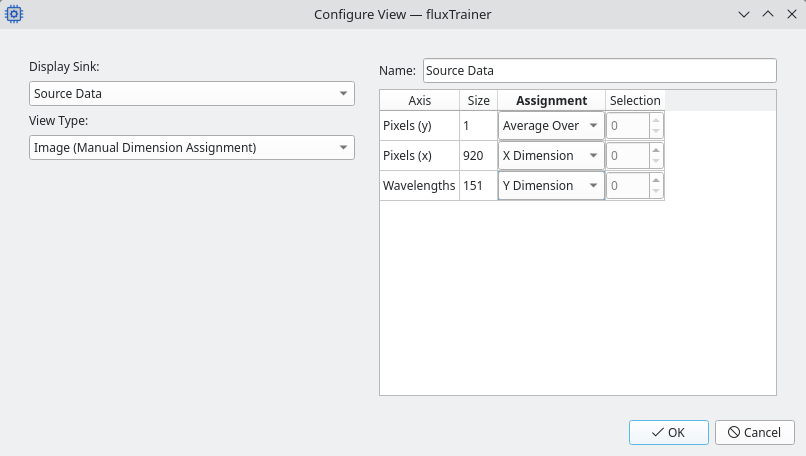
On the left side the user can choose which display sink should be used for the view, as well as the type of view. In this example model there are two display sinks, Source Data and Classification Data.
On the right side the user can configure the selected view. Each view can have a name (by default the name of the display sink is used). Additionally there are some additional options for some views that can be configured here.
fluxTrainer will automatically detect based on the structure of the data arriving at the display sinks what views will fit. These views will be added to the list of view types the user can select from.
Additionally the user can also select from a list of all view types when using Manual Dimension Assignment. In that case the user must specify themselves how each dimension of the data should be treated. Specific pixels can be selected, for example, to display scalar values at specific points in the image.
The following subsections describe the individual views and how dimensions can be assigned to them manually.
Image View
Displays a fixed-size image that is completely replaced when new data is shown. This view is only available automatically when fluxTrainer is connected to an imager camera. Otherwise the user must manually assign dimensions.
If the display sink that is used as the source data for this image is also connected to an object detector in addition to the image data, and automatic dimension assignment is used, fluxTrainer will draw red rectangles around the bounding boxes of detected objects. If additional data (such as a classification result) is also provided, that data is displayed in text form next to the rectangles.
The following manual dimension assignments are possible for this view:
Y Dimension: Exactly one dimension must have this assignment. Indicates which dimension is used as the y dimension of the image.
X Dimension: Exactly one dimension must have this assignment. Indicates which dimension is used as the x dimension of the image.
Color: The dimension in question should be used as a color dimension.
If the dimension already describes a color space, the color values will be converted so that they can be displayed on the screen.
If the dimension contains wavelengths, and the wavelength range fits visible light, automatic color determination will be performed when visualizing this data.
If the dimension has an exact size of 3, the data will be used as the red, green, and blue components of a false-color image.
Otherwise the dimension will be averaged and the image will be in grayscale.
Average Over: The dimension is averaged over and ignored.
Select: A specific entry in the dimension is selected. For example, if the dimension is a wavelength, this can be used to select a specific wavelength. If the dimension is a pixel, a specific pixel can be chosen.
When connected to a HSI line camera, the following manual dimension assignments can be used to display raw HSI frames (similar to those seen in the calibration view):
Waterfall View
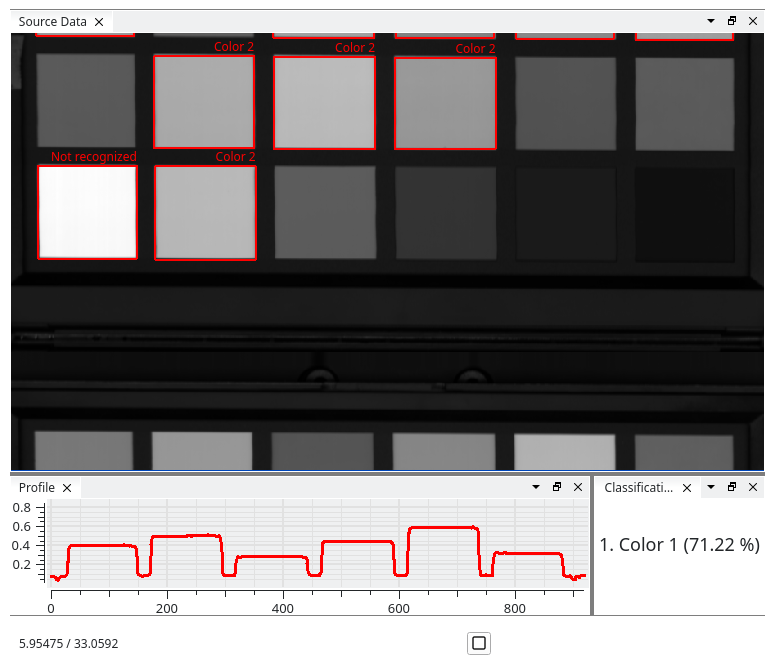
Displays a waterfall that concatenates successive lines from a line camera to an image. This is the same view that is also used in the Recording tab when connected to a HSI line camera.
If fluxTrainer is not connected to a HSI line camera, the view is not available at all (not even with manual dimension assignments).
If the display sink that is used as the source data for this waterfall view is also connected to an object detector in addition to the image data, and automatic dimension assignment is used, fluxTrainer will draw red rectangles around the bounding boxes of detected objects. If additional data (such as a classification result) is also provided, that data is displayed in text form next to the rectangles.
The following manual dimension assignments are possible for this view:
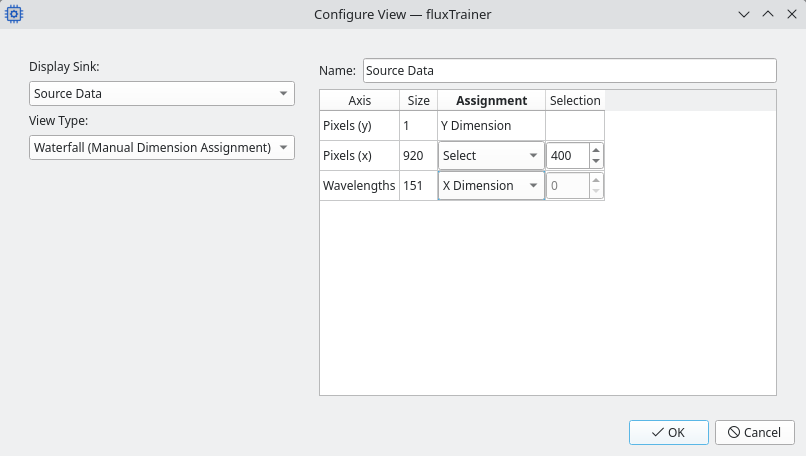
Y Dimension: This is fixed to the first dimension of the data.
X Dimension: Exactly one dimension must have this assignment. Indicates which dimension is used as the x dimension of the image.
Color: The dimension in question should be used as a color dimension.
If the dimension already describes a color space, the color values will be converted so that they can be displayed on the screen.
If the dimension contains wavelengths, and the wavelength range fits visible light, automatic color determination will be performed when visualizing this data.
If the dimension has an exact size of 3, the data will be used as the red, green, and blue components of a false-color image.
Otherwise the dimension will be averaged and the image will be in grayscale.
Average Over: The dimension is averaged over and ignored.
Select: A specific entry in the dimension is selected. For example, if the dimension is a wavelength, this can be used to select a specific wavelength. If the dimension is a pixel, a specific pixel can be chosen.
The following example shows how to configure a waterfall view with manual dimension assignments to create an image from the spectral dimension of the data (instead of the spatial dimension), by selecting a specific pixel:
Line View
Displays a chart view with a single curve in it. Unless fluxTrainer is connected to a spectrometer, this is typically only available with manual dimension assignment.
The following manual dimension assignments are possible for this view:
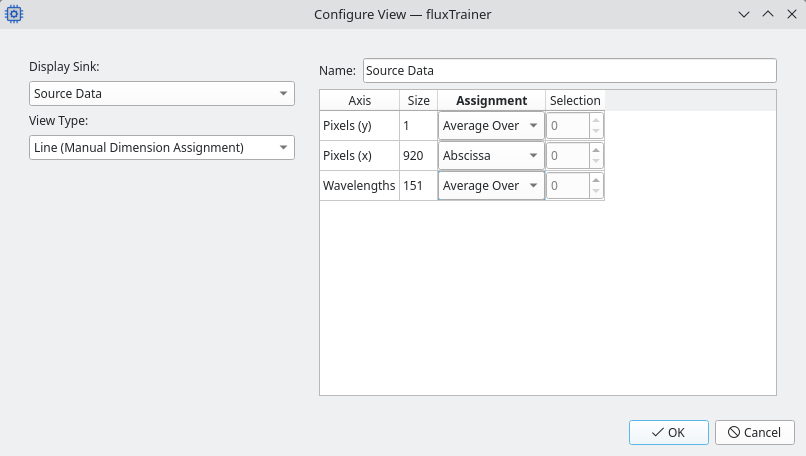
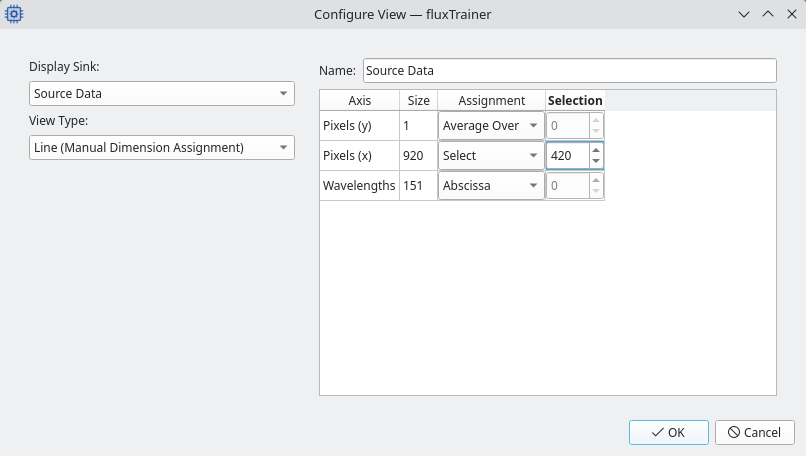
Abscissa: Which dimension is to be used as the x axis of the plot
Average Over: The dimension is averaged over and ignored.
Select: A specific entry in the dimension is selected. For example, if the dimension is a wavelength, this can be used to select a specific wavelength. If the dimension is a pixel, a specific pixel can be chosen.
The following example shows how to configure a line profile view of the reflectance data, averaged over all wavelengths:
In contrast, the following example shows how to show the spectrum of a specific pixel of the HSI line camera:
Scalar View
Displays a single scalar value per frame. This is only available with manual dimension assignment.
The following manual dimension assignments are possible for this view:
Average Over: The dimension is averaged over and ignored.
Select: A specific entry in the dimension is selected. For example, if the dimension is a wavelength, this can be used to select a specific wavelength. If the dimension is a pixel, a specific pixel can be chosen.
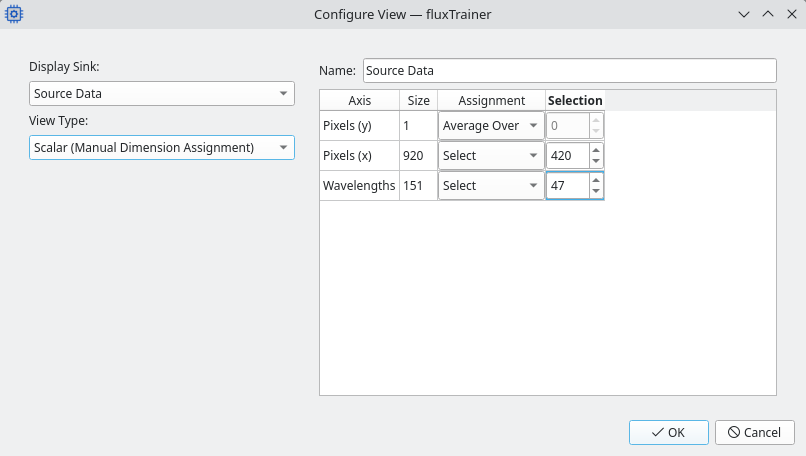
The following example shows how to display the reflectance value of a specific pixel at a specific wavelength:
Classification View
This is only available for display sinks that have been configured to include classification data with similarity levels. In that case this view will display one or more classification results with their according similarity levels. A single pixel must have been selected by the user for this view. The number of classification results shown will depend on the input data of the display sink.
The available manual dimension assignments for this view are:
Classification Match: Indicates the dimension that is to be used to extract the classification and the similarity level.
This must be left at the preselected dimension for this view.
Select: A specific entry in the dimension is selected. If the dimension is a pixel, a specific pixel can be chosen.
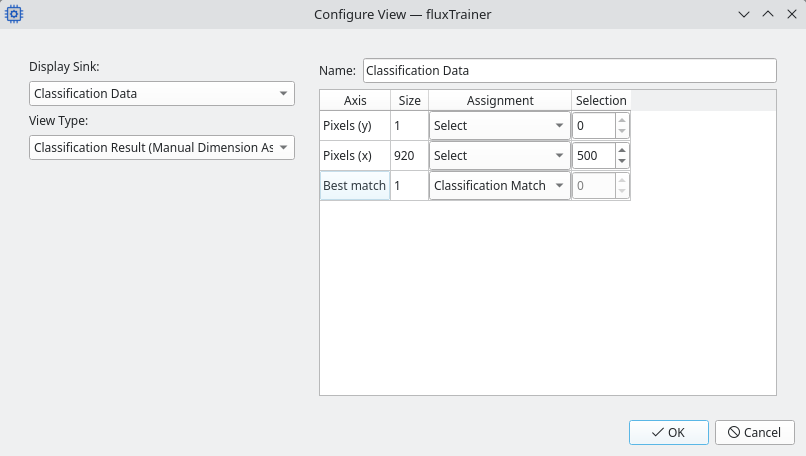
The following example shows how to display a classification result at a single selected pixel:
Saving the current view configuration
Once views have been configured, the current view configuration can be saved with the Save Config button at the top of the Player Settings box.
If the model was loaded from disk, the player settings will be stored
in the .fluxmdl file. If that file is then loaded again in the
Player, those settings can be restored. fluxEngine will ignore any
player settings that are stored in this manner.
If the model was taken from the current model in fluxTrainer, clicking on the Save Config button will save the settings in the current fluxTrainer project file.
Warning
When saving the settings in the current fluxTrainer model, they are not stored on disk. Instead they are just recorded in the current fluxTrainer model. To store the player settings on disk the current fluxTrainer project must also be saved.
In addition to which views the view configuration also stores the current arrangement.
Arranging Player Views
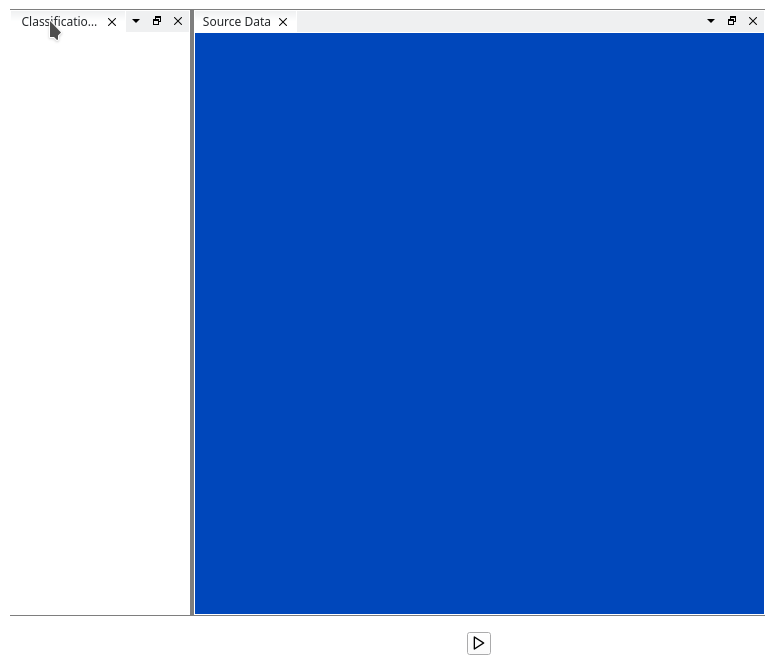
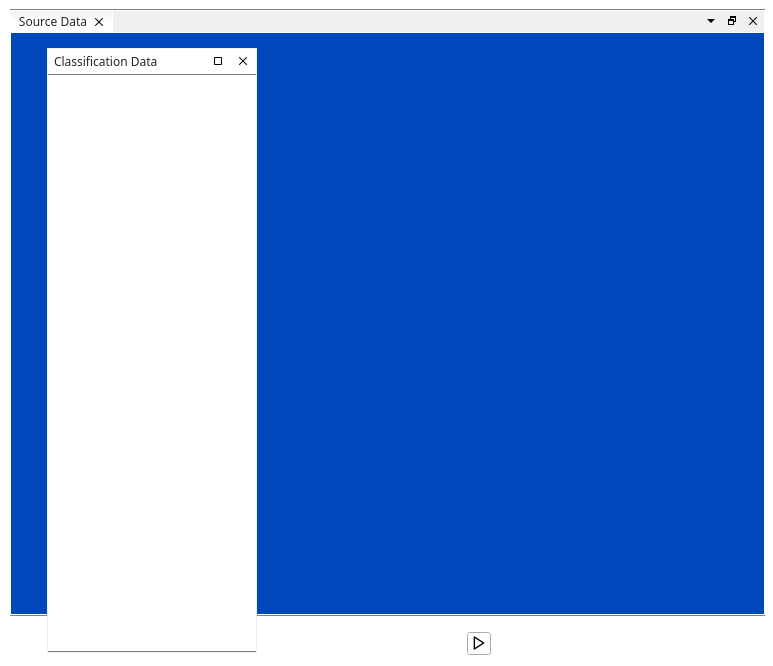
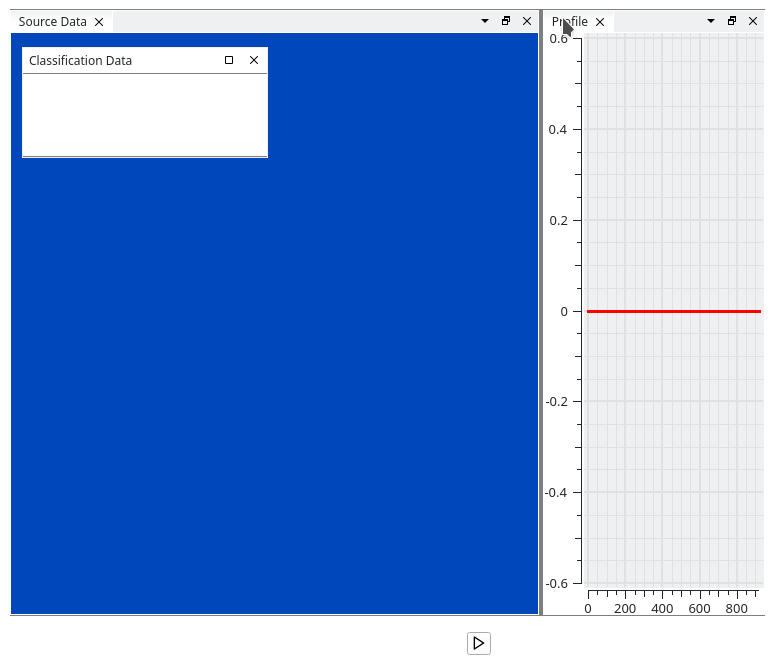
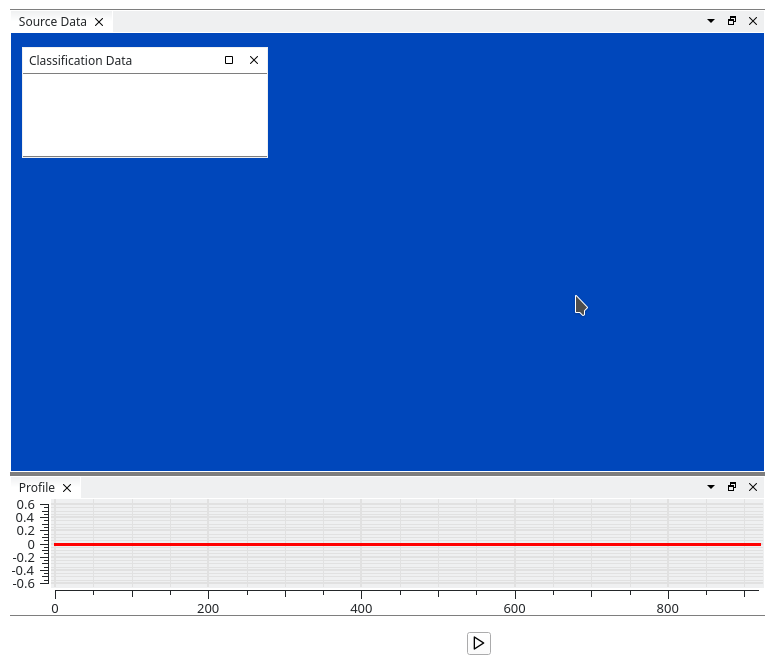
Once one or more views have been configured, the user may switch to the Player tab. By default it will have all views organized horizontally:

The user can rearrange the player views by dragging them by their title. They can be taken out to be external windows, they can be tiled in any arbitrary configuration, and they can be combined to tabs that only show one of the tabbed views at the same time.
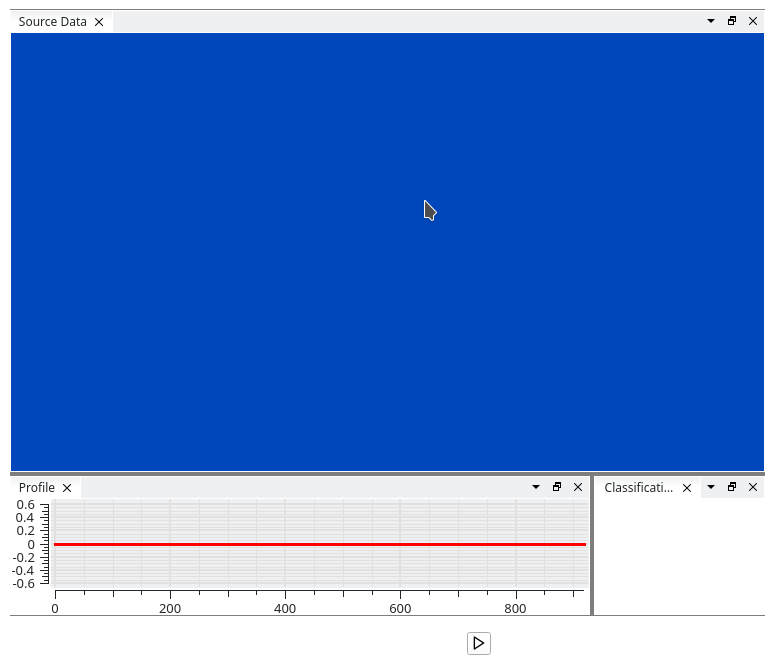
To drag a view out to become its own window, press the left mouse button on the title par of the view, and then drag the mouse away from its current position:
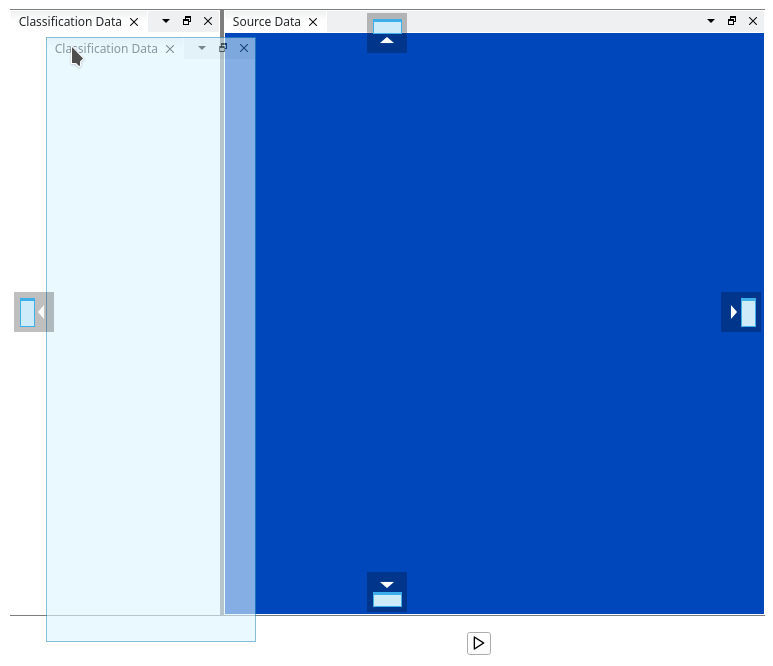
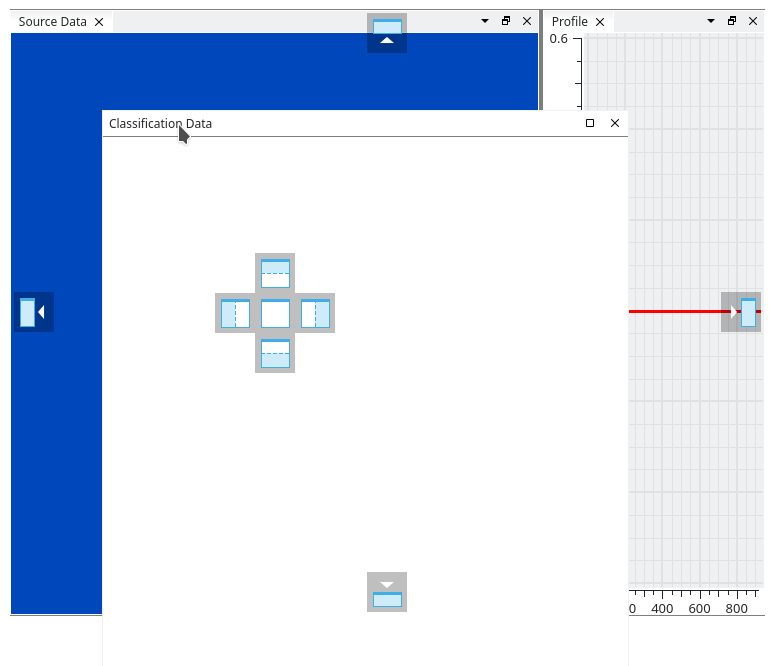
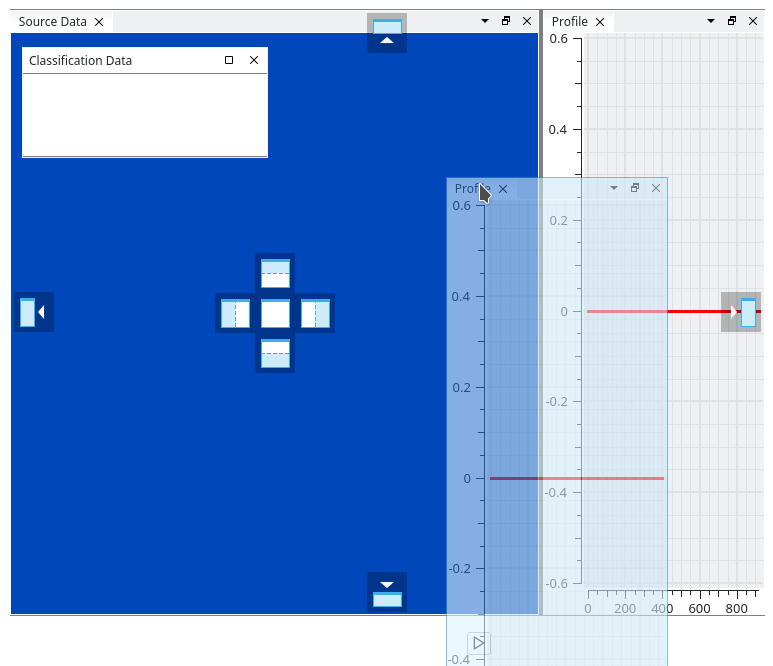
To combine a view with another view in tabbed form, drag the view to the center of the other view:
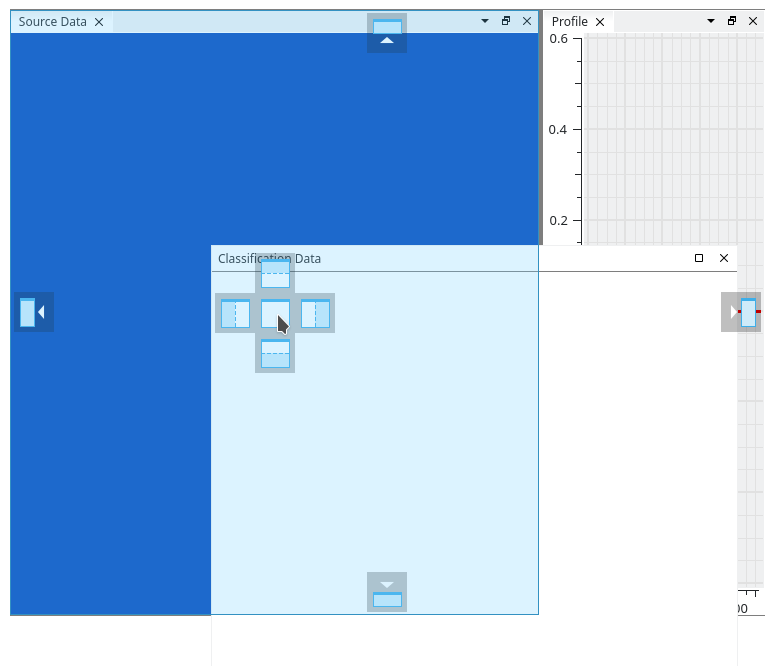
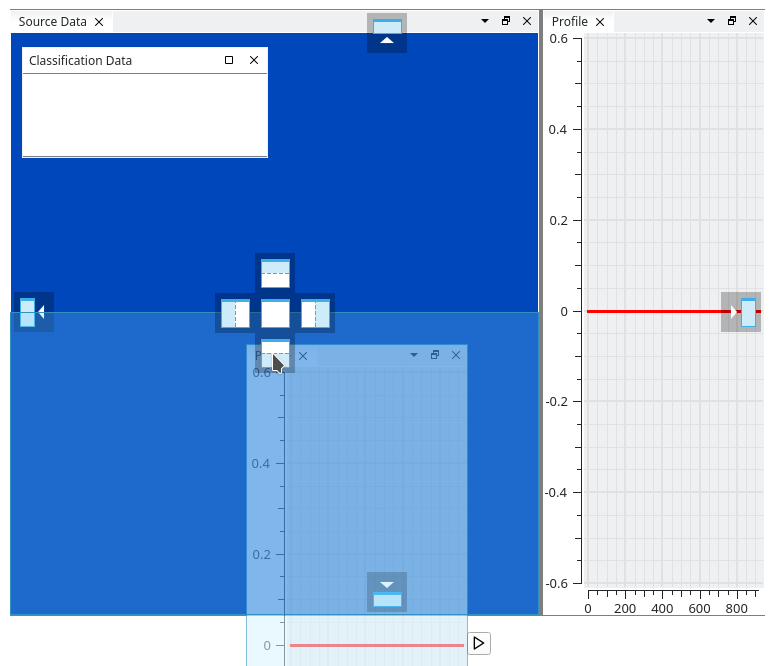
To drag the windowws in order to tile them differently, drag them to the appropriate tiling position:

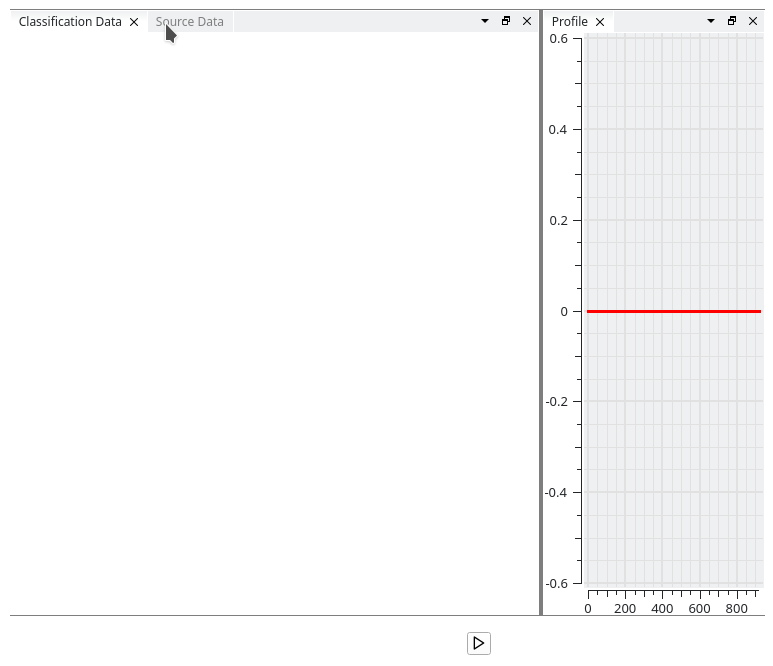
The boundaries between views can also be resized:

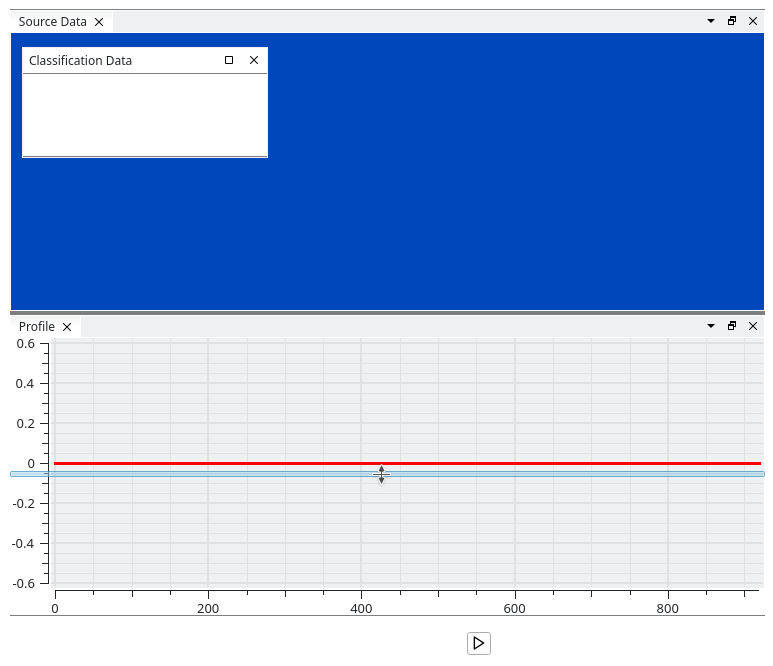
If there are many views present, tiling can be organized in various different ways by the user, because subdivisions are possible:
Running Player
Press the Play button to start the player. The views will automatically update with the data that is being processed.
If a Y axis motion control device is connected, the player will also start the motion of the device, and once the motion has come to an end, the player will automatically stop.
If there is no motion control device connected, the player will continue until the user stops the player manually by pressing the Stop button.
The following screenshot shows the player when it is active with an example model and various views that have been configured: