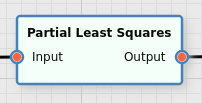
Partial Least Squares Filter
Quantifies data by performing a Partial Least Squares fit.
Category |
|
Node |
|
Parameters |
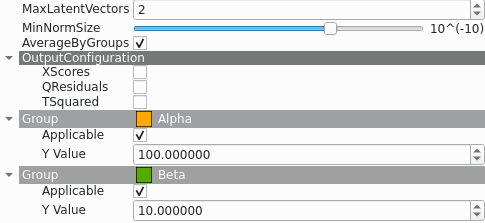
MaxLatentVectors: the maximum number of latent vectors to use for the PLS MinNormSize: the minimum norm size required of the orthogonalized latent vector during the iterative algorithm. This is both used to determine if convergence wasn’t reached, as well as a cutoff criterion in case the data could already be explained by less than MaxLatentVectors latent vectors AverageByGroups: whether to average the inputs of all groups before performing the PLS algorithm, or to use the individual data points of the inputs individually OutputConfguration: whether to output additional data, such as the XScores, the QResiduals or the TSQuared values Applicable (per group): whether a group is applicable for this filter YValue (per group): the Y value of the group |
Inputs |
Input: the input data to perform the regression on |
Outputs |
Output: the result of the regression XScores (optional): the X scores of the input data QResiduals (optional): the residual variation after projection to the subspace for each individual pixel TSquared (optional): the Hotellings |
Effect of the Filter
This filter attempts to perform a partial least squares (PLS) regression for a single value (given by the YValue parameter for each Applicable group) on the training data it receives. It will then apply the result of the regression to all of its input data, yielding a singular value for each individual data point (pixel).
In order to set this up the user must assign the input data to various groups, and then select that the PLS filter is applicable for those groups, and provide a Y value for each of them. The following screenshot shows an example of how these parameters could be set up:

This filter is useful when machine learning is to be used to quantify measurement data, such as the concentration of a measured substance.
