Baseline Correction Filter
Calculates a mask based on specific criteria as a means of determining which pixels belong to the background and which do not.
Category |
|
Node |
|
Parameters |
Polynomial Order: The order of the polynomial that is fitted Subtraction Terms / 0th Order: whether to subtract the zeroth order term of the polynomial from the output Subtraction Terms / 1st Order: whether to subtract the first order term of the polynomial from the output Subtraction Terms / 2nd Order: whether to subtract the second order term of the polynomial from the output Subtraction Terms / 3rd Order: whether to subtract the third order term of the polynomial from the output |
Inputs |
Apply Input: the input to apply the correction to Fit Input: the input to use to fit the polynomial (this may be the same data as Apply Input) |
Outputs |
Corrected: the corrected data Baseline (optional): the fitted baseline polynomial |
Effect of the Filter
The filter will fit a polynomial of the selected order to the data provided in Fit Input separately for each pixel. It will then subtract that polynomial (or at least specific terms of that polynomial) from the data in Apply Input.
This filter is useful to remove specific baseline effects from data that are not relevant to the further analysis. For example, fitting a polynomial of 0th order (i.e. a constant) will center the curve of each pixel around zero.
The user can specify a different input to use for fitting the polynomial from the input to which the correction is applied. This is useful mostly for the case when the user wants to restrict the fit range with a Channel selection filter before performing the fit, but still apply the correction to full data. It is however possible to connect the same data to both the Fit Input and the Apply Input of the filter.
The user can decide to only subtract specific terms of the fitted polynomial if that aids in further data analysis. By default the entire fitted polynomial will be subtracted.
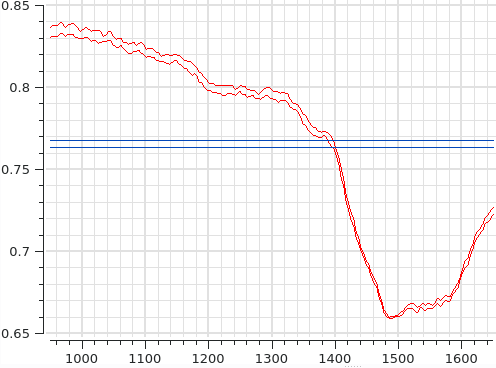
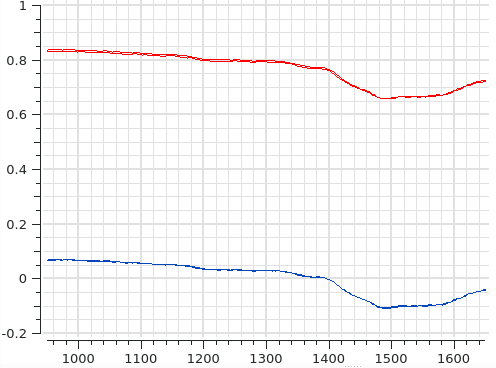
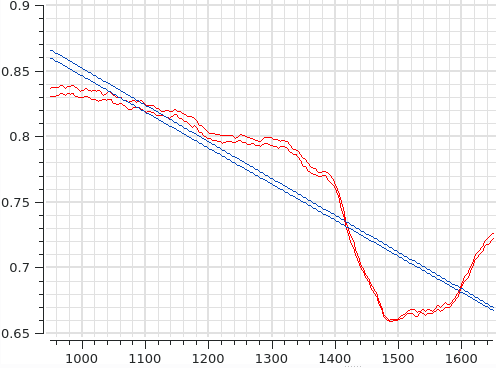
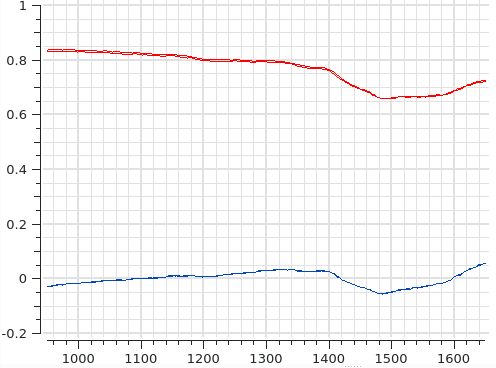
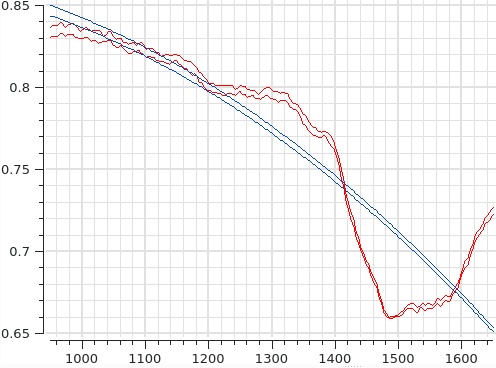
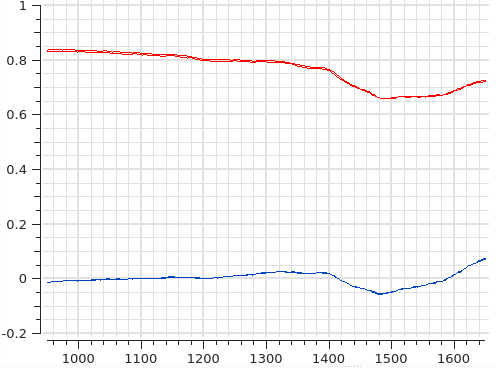
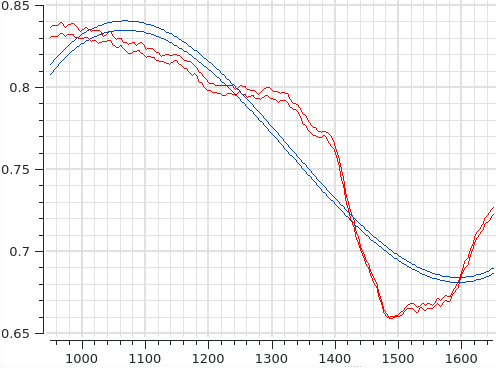
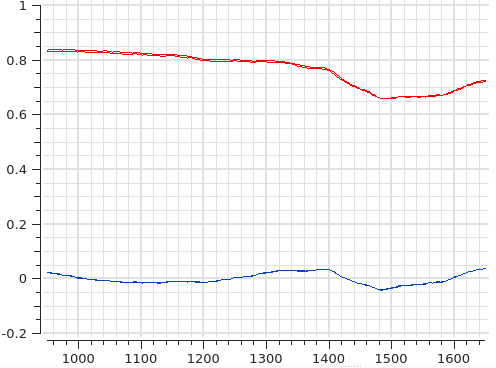
The following table shows the effect of the baseline correction filter applied to two spectra. In the left column the origin spectrum (red) is compared to the baseline that was fitted to it (blue). In the right column the original spectrum (red) is compared to the corrected spectrum after the baseline has been subtracted. (In these examples all polynomial orderse have been subtracted.)
Order |
Fitted Baseline |
Corrected Spectrum |
|---|---|---|
0 |
||
1 |
||
2 |
||
3 |
