Object Region Averaging Filter
The object region averaging filter allows the user to define regions within the bounding box of detected objects that will then be averaged.
Category |
|
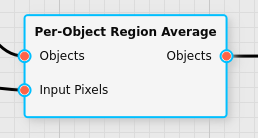
Node |
|
Parameters |
Defined Regions: the defined regions within each object |
Inputs |
Objects: a list of objects as generated from an object detection filter Input Pixels: the input pixel data |
Outputs |
Objects: the list of objects augmented by the result of the region average |
Effect of the Filter
For each object in the input the filter will determine the precise location of each user-defined region, and average all pixels that are part of that region.
Defining Regions
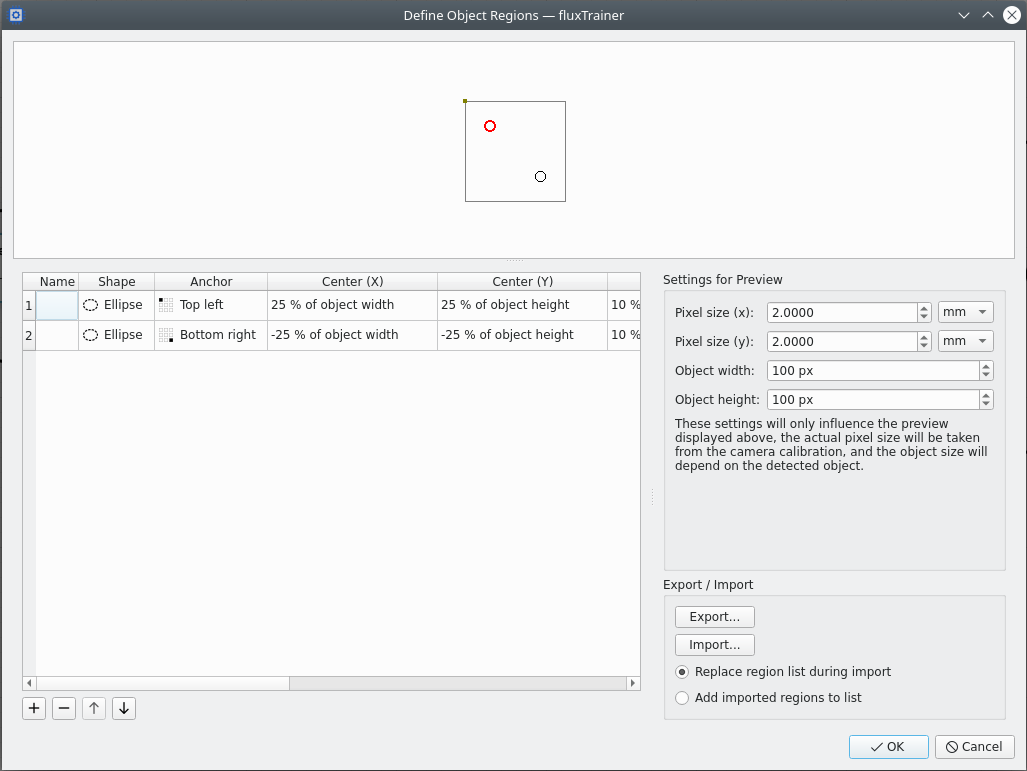
The parameter edit widget of the Defined Regions parameter has a button with the text … to open the region editor that allows the user to define the various regions within the object. The following screenshot shows how that window looks like when no regions are defined:
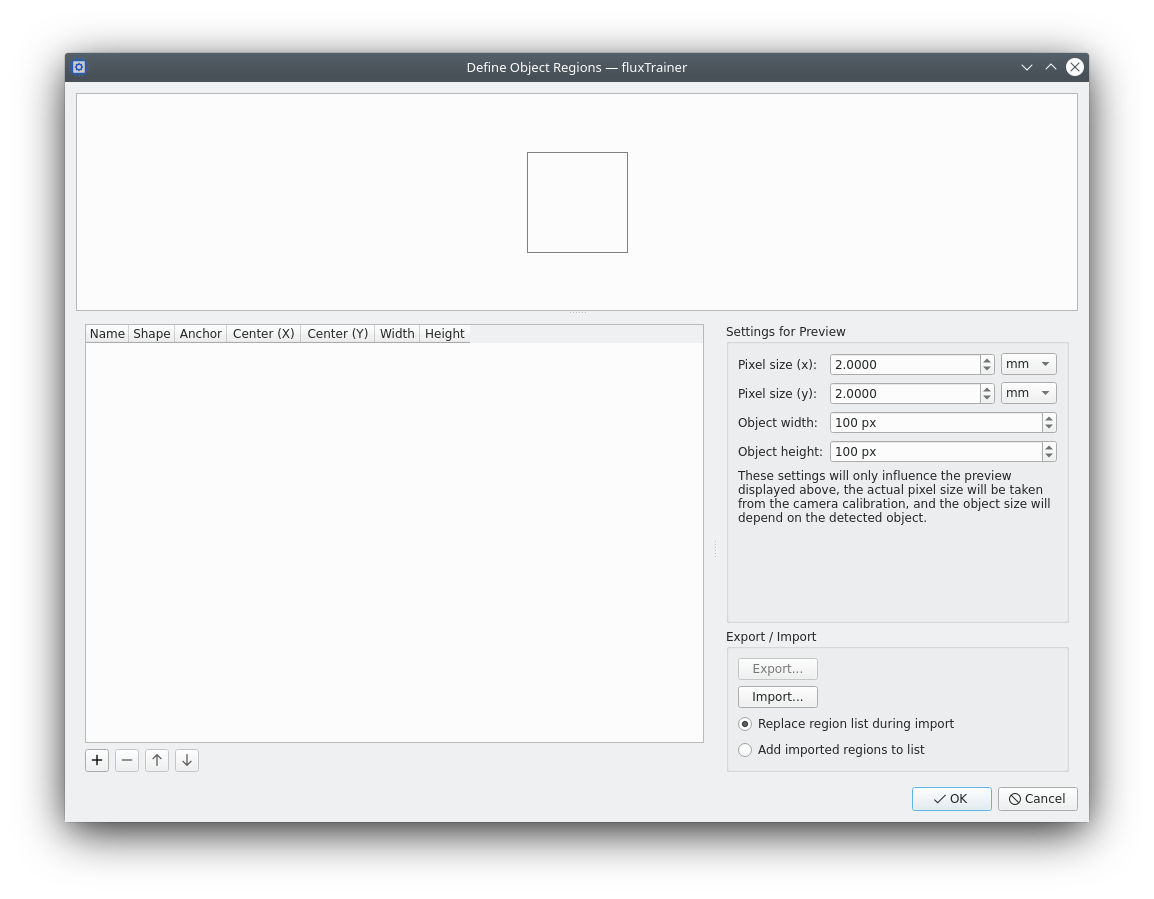
The editor window is divided into 4 areas:
At the top there is a preview that shows where the regions are defined within the bounding box of an object
On the left there is the list of defined regions that the user can use to edit the regions.
In the center right there are settings related to the preview that is shown. (See below.)
In the bottom right the user has the option of importing and exporting defined region lists. This is useful if they want to reuse a region list for different models.
Regions are defined by the following attributes:
Name: a user-supplied name that is there for informational purposes only. This may be left blank.
Shape: what shape the region has. This may currently be either Rectangle (to indicate a rectangle or a square) or Ellipse (to indicate an ellipse or a circle)
Anchor: where in the object’s bounding box the region should be anchored to. This can be a corner, the center, or the center of a side
Center offset (in x and y): the offset relative to the defined anchor for the center of the region
Width/Height: the size of the region
All quantities that describe the offset of the region (Center (X), Center (Y), Width, Height) may be specified in one of the following units:
Pixels
Relative quantities (ratio, percentage): in this case the quantity will be relative to the corresponding size of the object. For example, if the Center X setting is set to
25%then this means that the actual center of the region will be 1/4 the width of the bounding box to the right of the chosen anchor. This is useful if objects have different sizes.Physical quantities (millimeters, etc.): in this case the absolute pixel size that is available during processing will be used to determine to how many pixels a given physical length will map to.
The units may be selected independently for each of the quantities of each region, so it is possible to define a region that has a width specified in millimeters, a height in pixels, and an offset in relative quantities.
If no pixels that actually belong to the object are within the defined region (because the bounding box is always a rectangle, but the object itself need not be), the result of the averaging process will be NaN.
Note that the settings for the preview in the center right of the dialog are only used to allow the user to better visualize the regions while defining them; these settings will not be stored and have no influence on the actual processing of the filter.
To add a region to the list of regions, press the button with the +
symbol below the region list. To remove a region, select it and press
the button with the - symbol. The arrow buttons may be used to
reorder the existing regions.
The following screenshot shows the dialog when just one region has been added (but it has not yet been edited):
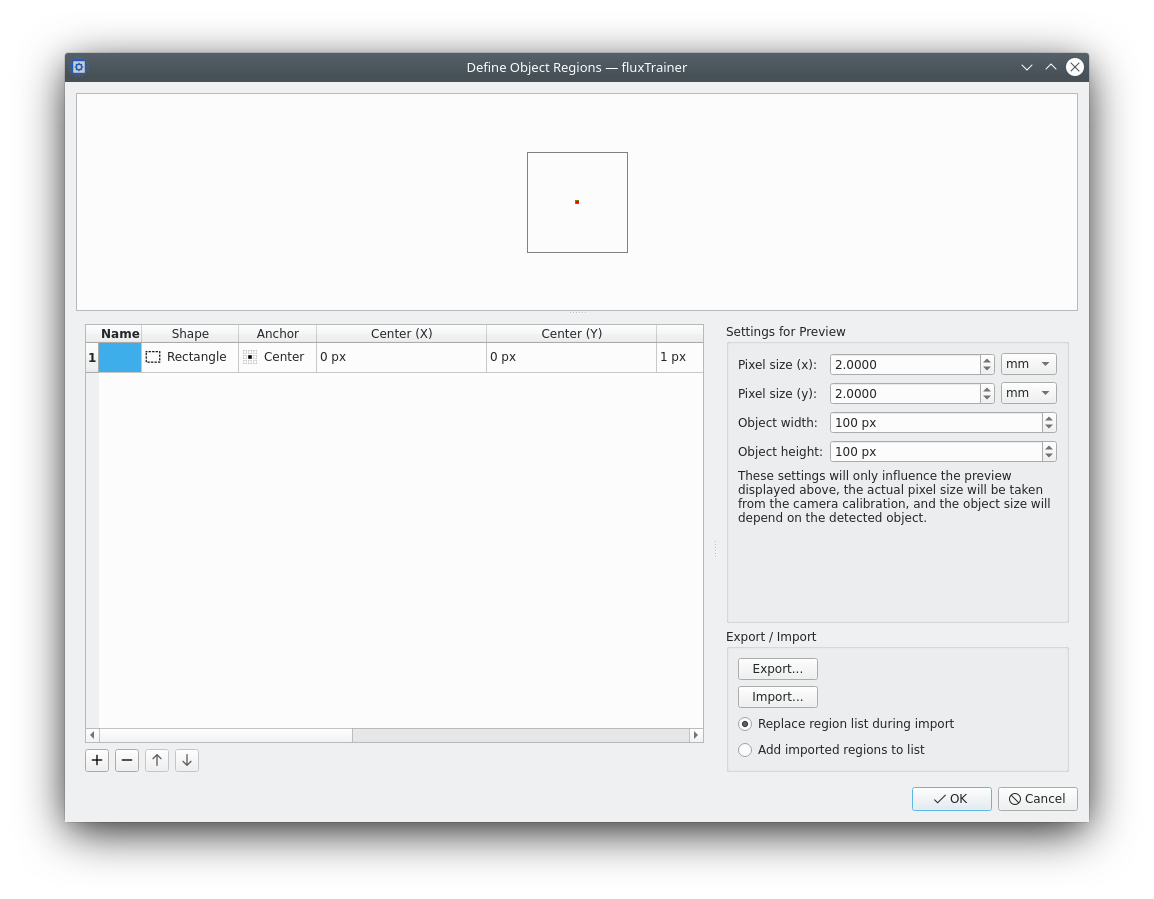
To edit the region, either double-click into an individual cell, or press the F2 button on the keyboard while a specific cell is selected. This will open an edit widget that allows the user to edit the region. For the Name field the user will be able to enter any text string they want.
For the Shape and Anchor fields the user will be shown a drop-down that allows them to select the chosen shape and/or anchor.
For the offsets and sizes of the regions the user will be presented with a widget that allows the user to specify both the magnitude as well as the unit of the quantity. The following screenshot demonstrates how the user may select a different unit:
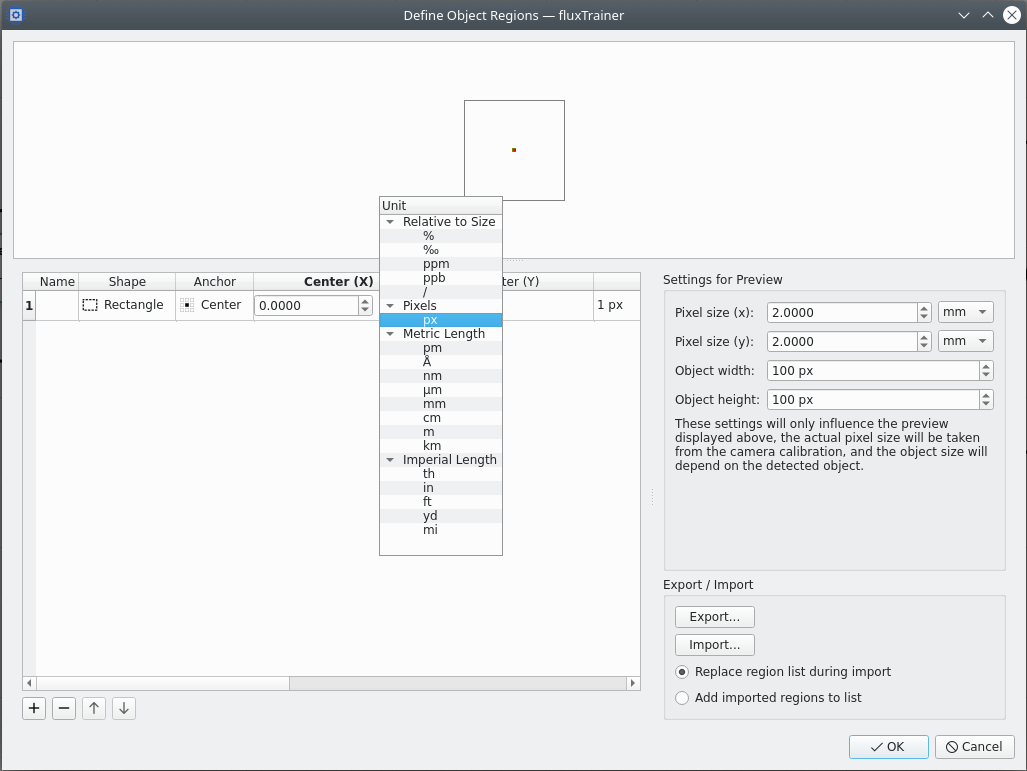
When selecting a new unit the magnitude will automatically be converted so that the current value does not change. (For the purpose of the conversion while selecting a new unit, the settings for the preview will be used. However, once a quantity is stored in the filter’s settings and the filter is applied, the actual pixel and object sizes will be used to map the given quantities onto pixels.)
The following screenshot shows an example with two defined regions that are circles at two points within the bounding box of the object.
Visualizing Results
When visualizing results fluxTrainer, since the regions are defined on a per-object basis, fluxTrainer will offer a second table list below the object list that contains each defined region, including the average values of that region. If the average of the region can be plotted as a chart, a chart view is also provided. The following screenshot shows such a visualization for two regions defined when applied to a model that classifies almonds:
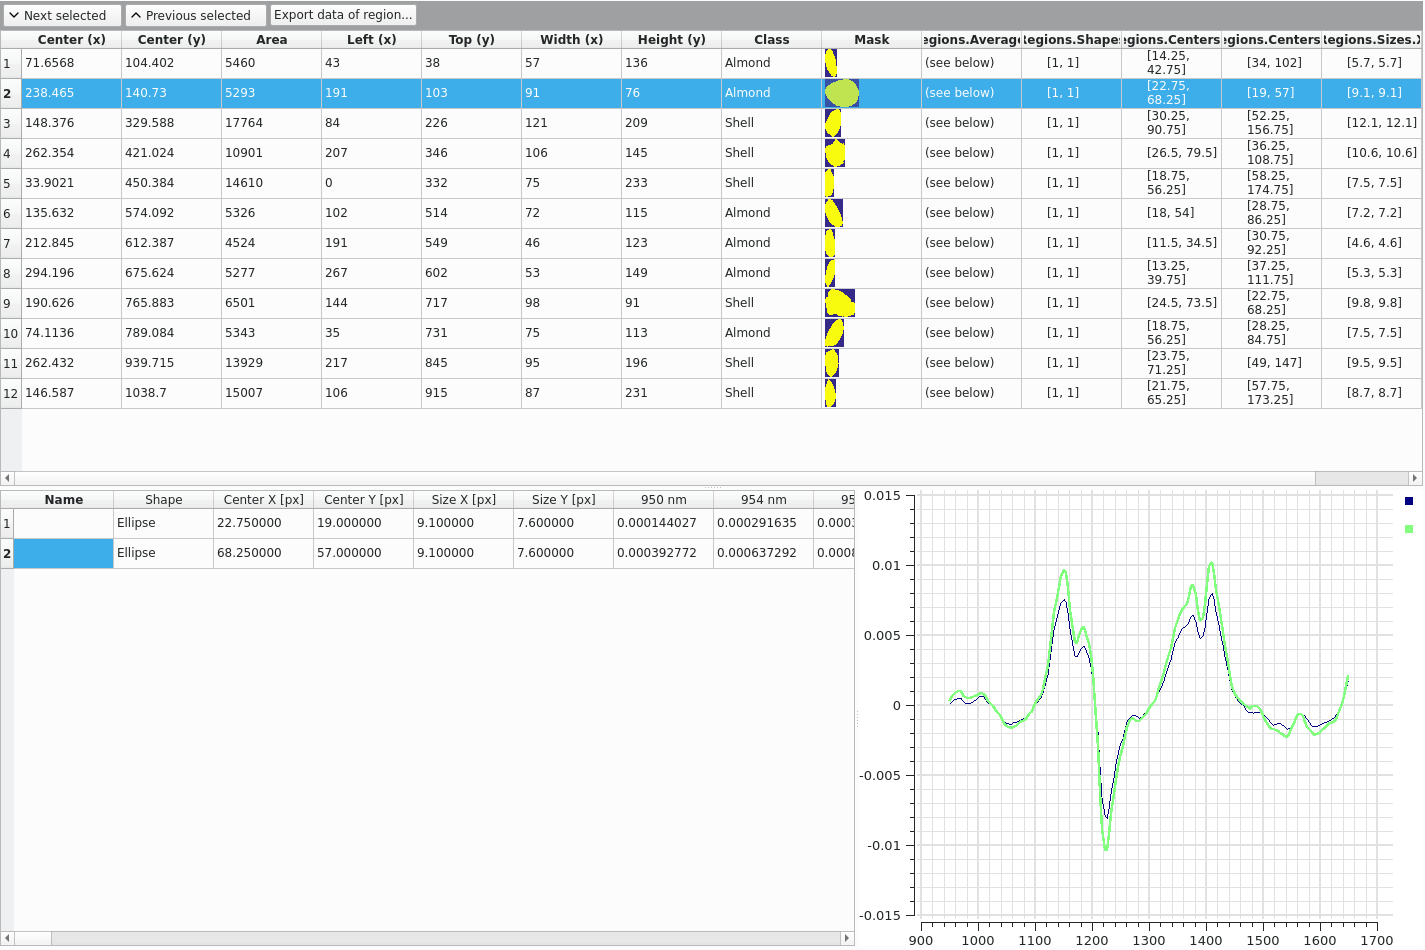
The user also has the ability to export the data of the currently selected region with the button Export data of region…. This will export the averages of that specific region. Exporting as CSV is always possible; but if the average data is spectral in nature, the result can also be exported in the ENVI and/or JCAMP-DX formats.